


An animation released by NASA this week with pictures reveals the consequences of the climate crisis: Our planet is getting hotter and hotter over the past few centuries.
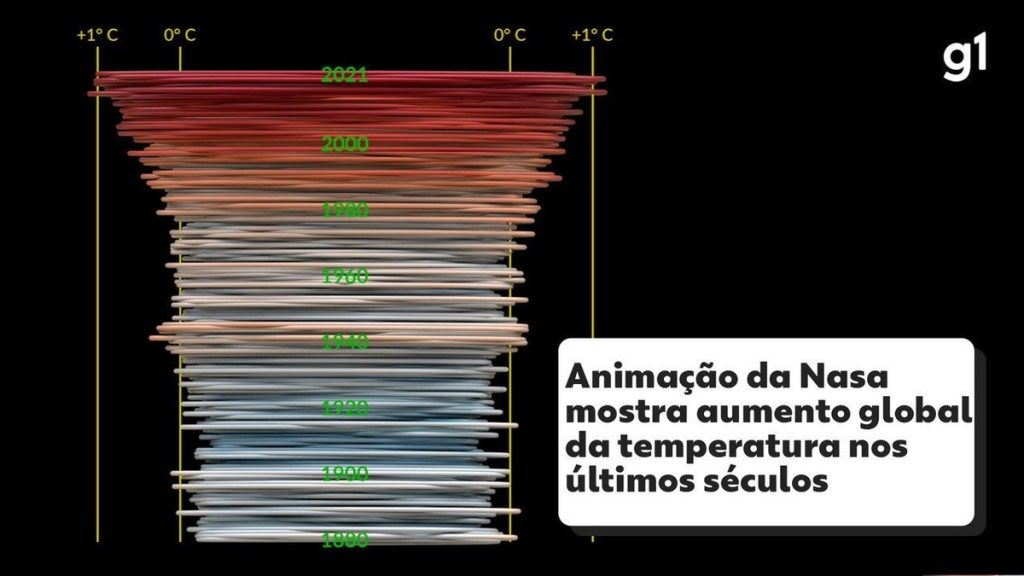
The climate spiral shows monthly changes in global temperatures Between 1880 and 2021, in a visualization of the circular lines around three circles indicating an increase or decrease of 1 degree Celsius. Opinion depends on the index GISS Surface Temperature Analysis (GISTEMP v4), Which collects comprehensive data on the Earth’s surface temperature.
Carlos Rettle, an environmental and public policy expert at the Rainforest Foundation in Norway, explains that the IUD is a way to show Monthly variation of Earth’s temperature About Average temperature before the industrial revolution.
“It’s a way of representing global warming in relation to pre-industrial levels, since humanity began burning fossil fuels on a large scale and emitting greenhouse gases on a large scale,” he said.
Ritll points out Colors have become stronger in recent decades, a period when global warming is accelerating, approaching and passing, in recent years, one degree Celsius (compared to 1880).
The visualization is a project of the Goddard Institute for Space Studies (GISS), a NASA laboratory, in partnership with the Earth Institute at Columbia University and the New York College of Engineering and Applied Sciences.
2021 frame animation. The red lines indicate how the global temperature will increase over time. Photo: NASA’s Science Visualization Studio
“As temperatures continue to rise, we expect an increase in extreme weather events. In general, we expect wet areas to become wetter and drier. This will lead to more fires and hurricanes. The Arctic is warming faster than in the rest of the planet, which will lead to more melting. Ice and subsequent rise in sea level g 1 Mark Subbarao, leader of NASA’s Science Visualization Studio, which created the new version of the visualization.
The animation was originally designed by climate scientist Ed Hawkins of the National Center for Atmospheric Sciences at the University of Reading. A version of the snail was even revealed at the opening ceremony of the 2016 Olympics in Rio de Janeiro.
“Science indicates that the safest limit for global warming, within what can still be reduced, is 1.5°C by the end of this century. We have already crossed 1°C and the results are stronger and more often extreme weather phenomena, Like rain in PetropolisThat caused hundreds of deaths, or devastating hurricanes in Central America, or dramatic droughts in extremely poor countries in the Horn of Africa, just to name a few,” adds Rittle.
The researcher sees that the spiral It helps to show that the planet is so close to crossing a boundary that it should only be reached in about 80 years And it is necessary to speed up to reverse this situation.
“We must act more quickly and responsibly, eliminating fossil fuels, deforestation, and producing food sustainably to avoid more serious consequences for ourselves,” he says.
bar width
Global warming streaks 1850-2018 – Photo: Disclose / Show Your Lines
Climate scientist Ed Hawkins was also responsible for translating data on Earth’s temperatures into a series of lines, a model that has gained immense popularity in recent years, even printing pants, sandals, and even cars.
The visualization has blue lines representing cold years and red being the warmest. Each bar represents the average temperature of a region over a year.
In an interview with g 1 In 2019, the researcher said the model’s simplicity is a huge advantage, because it’s a “good way to start a conversation” about climate change that ends up getting lost in complex tables and graphs for meteorologists.
“Scientists often talk with complex drawings. This is how I’ve found to be able to communicate with more people: We use color to represent changes, blue is used for cold years and red is for hotter, so there is no difficulty in understanding,” an expert.

“Incurable thinker. Food aficionado. Subtly charming alcohol scholar. Pop culture advocate.”
More Stories
System software update 24.03-09.20.00 is available for PS5
Samsung is including the Galaxy S23 line in its refurbished item sales program
Grand Theft Auto V will feature a story expansion, Trevor's rep says